5 Human Resources Metrics Every CEO Needs
Every successful CEO knows that company performance is directly tied to its ability to manage costs, minimize liabilities, and maximize employee potential. Keeping a finger on this pulse is important; small shifts in turnover, recruitment, benefit cost containment, and team chemistry can make a huge impact on long-term viability, growth, and profit margins.
Today, that “pulse” is now readily available on online dashboards of human capital management software. When supported and used fully, HCM software can improve hiring quality, reduce employee turnover, contain rising costs, and provide instant access to the latest human resource data, analytics, and reports.
Here are the 5 HR metrics you need to measure today!
Competition Compensation Analysis
Establishing competitive market rates for core positions guides decisions about hiring, promotions, internal equity salary adjustments, and general compensation budget planning. Because labor costs are the largest cost to any organization, a solid understanding of the external value of each position allows an organization to develop an approach for setting an overall compensation philosophy and set a consistent tone throughout its organization.
Compensation benchmarking also provides the information leaders need to define the costs associated with salaries and other compensation components such as profit sharing or bonuses. The ability to balance the needs of attracting and retaining talent with fiscal corporate responsibility is often a key priority for Executives, which is why this metric is important.
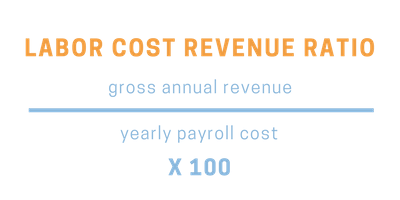
Labor Cost Revenue Ratio
Calculating gross revenue to payroll percentage is relatively straightforward but often overlooked. By dividing the gross revenues by the total payroll and convert to a percentage, you can determine how much it costs in labor per amount of revenue generated. For example, if your gross annual revenues are $500,000 and you spend $100,000 on payroll for the year, your gross revenue to payroll percentage is $100,000/$500,000 = 0.20, or 20 percent.
Total labor costs, or percentage of gross revenues spent on payroll, vary dramatically by industry; in general, however, the lower the ratio, the better it ends up being for business.
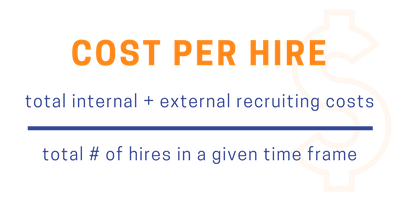
Cost Per Hire
Breaking down your cost per hire is an important strategic tool to assess effectiveness and efficiency of your recruiting process. This metric helps identify areas for improvement and can guide recruiting budgets.
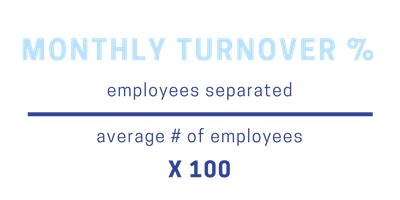
Monthly Turnover
Employee turnover rate refers to the percentage of employees who leave an organization during a specified period. People usually include voluntary resignations, dismissals, and retirements in their turnover calculations. They normally don’t include internal movements like promotions or transfers. However, most companies find quarterly or annual turnover rate calculations uniquely useful; it usually takes longer for numbers to get large enough to show meaningful patterns.
Benefits Cost Per Employee
One of the toughest decisions employers have to make is how to distribute employee benefits. Many employers decide employee benefits by looking at an annual report published by the U.S. Bureau of Labor Statistics. This report reviews the average salaries and benefits paid to both private and government workers. The December 2016 report showed that benefits make up 31.6% of the average laborer’s paycheck. We’ve even seen these statistics suggesting this number to be as high as almost 44% of the average laborer’s paycheck.
Of course, human resources is much more than a numbers game. Highflyer HR provides data-driven solutions freeing up time for you to create an engaged workforce that feels respected, satisfied, and compensated in the ways they value.
If you would like help assuring your HR technology aligns with your HR strategies, schedule an assessment with Highflyer HR, contact us at (844) 398-7800 or getstarted@highflyerhr.com.


